📊How to Detect Financial Savvy: A Look at Skill Recognition
Ditch traditional indicators and explore actuarial principles that weigh frequency and magnitude for a clearer view of trading talent.
#keypoints
Daily Educational Content [Free]:
How to Detect Financial Savvy: An In-depth Look at Skill Recognition in Finance
Unearthing Actuarial Gems in Skill Detection
The Magic of Averages - Batting Average
The Magic of Averages - Batting Average
Power Hitting and Finance – The Slugging Percentage
Spotlight on the Expectancy Ratio
Skill Detection Across Various Strategies
📈Case Study [Free]:
Alfa Hedge Strategy vs Buy And Hold on Bitcoin.
Bottom Line
Comparative Skill Assessment – The New Norm
How to Detect Financial Savvy: An In-depth Look at Skill Recognition in Finance
When it comes to finance, sifting through talent can be a difficult endeavor.
Traditional indicators, such as the Sharpe ratio, often fall short of revealing the full picture.
Instead, what if we turned our attention to actuarial principles that weigh frequency and magnitude?
Let's delve deeper into this novel approach to detect skilled trading and successful investment strategies.
Unearthing Actuarial Gems in Skill Detection
When assessing the skill level of a an investment strategy, two pivotal questions emerge:
How often does a particular strategy result in profits?
How significant are the gains or losses when a strategy is right or wrong?
This line of inquiry helps evaluate the probability of gains, as well as the expected rise or dip.
The Magic of Averages - Batting Average
An investment strategy proficiency is often reflected in their Batting Average or Hit Rate, which calculates how frequently they secure profitable positions.
This measure offers insights into an investment strategy timing skill – the knack for making correct wagers.
Power Hitting and Finance – The Slugging Percentage
Next comes the Slugging Percentage, a ratio indicating the average gains to losses.
This metric is representative of an investment strategy sizing skill, namely the capacity to optimize winning trades while minimizing losses.
These measures underpin important concepts like the Kelly criterion.
Spotlight on the Expectancy Ratio
A crucial metric for assessing investors is the Expectancy Ratio.
It's the product of two elements: the gain versus loss and the probability of gain versus loss.
This ratio encapsulates both the scale and the likelihood of gains against losses.
To comprehend an investment strategy skill more thoroughly.
Skill Detection Across Various Strategies
Different strategies can produce varied hit rates and slugging percentages.
For instance, a carry strategy might boast a high hit rate but a low profit-to-loss ratio due to smaller gains and potential outsized losses.
In contrast, a trend strategy could have a lower hit rate but greater gains against losses if profitable positions are maintained and losses are trimmed.
📈Case Study
Alfa Hedge Strategy vs Buy And Hold on Bitcoin.
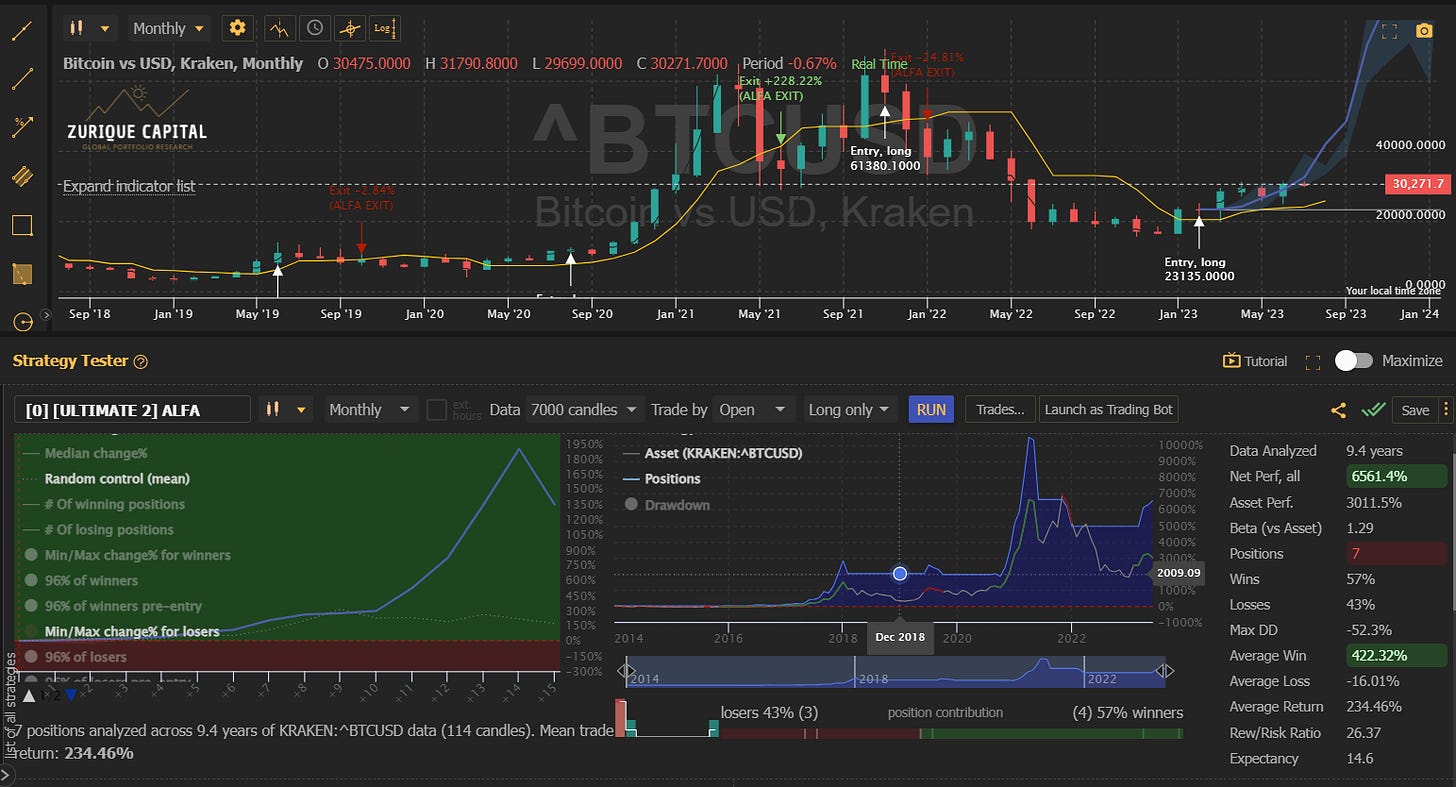
We use the TrendSpider Platform to collect the data of our Alfa Hedge Strategy as seen bellow.
As seen on the data, the Alfa Hedge Strategy (a Market Cycle Strategy with Trend-Following overlay) the strategy performance over 9.4 years were 6,561.4% (Net Perf) and the Buy & Hold performance was 3,011.5% (Asset Perf.).
Batting Average:
Profitable Positions (Wins): 57%
Slugging Percentage:
Average Win: 433.32%
Average Loss: -16.01%
Average Return: 234.40%
Rew/Risk Ratio: 26.37
Expectancy Ratio: 14.6
To define the Position Size in on the Alfa Hedge Portfolio, we combine this data through the Kelly Criterion.
But we only assemble a position if the asset is on Positive Market Cycle.
Is It time to have Bitcoin on Alfa Hedge Portfolio?
Every business day we update the evolution of the Alfa Hedge Portfolio II with our positions accordingly with the Market Cycle.
Premium Subscribers have full access to our Alfa Hedge Portfolio II in a Real-Life Brokerage Account in Real Time.
Bottom Line
Comparative Skill Assessment – The New Norm
Breaking down investment strategy skill into these components allows for a more nuanced comparison between investment strategies across backtested and live periods.
This approach provides well-structured test statistics for comparison and offers a more in-depth understanding of an investment strategy skill type.
This perspective is useful not only for traders but also for investors who follow strategies such as ours in the Wall Street Insider Report.
Remember, "Investing smarter" also means choosing the right strategies and people to follow. So, equip yourself with the right analytical tools and start making informed decisions.
If you liked this content, you will love our Report.👇
Wall Street Insider Report
Demystify the MARKET CYCLES investing SMARTER in Wall Street
Theory + Action: Learn & Replicate a High Performance + Low Maintenance + Long-Term Portfolio
Join +13k Global Investors and Really Master the Market Cycle Investing


