U.S. vs Europe Investing Showdown
📶Decoding the S&P500: U.S. Market Cap Dominance | The Real Data Behind U.S. and European Productivity
Wall Street Insider Report
Decoding the S&P 500 Market Cycle and sharing the blueprint here in the Wall Street Insider Report.
Join +1.8k Wall Street Insiders across 55 countries.
S&P 500 TRACKER
U.S. vs Europe Investing Showdown (1/3)
U.S. Market Cap Dominance: What the Data Reveals

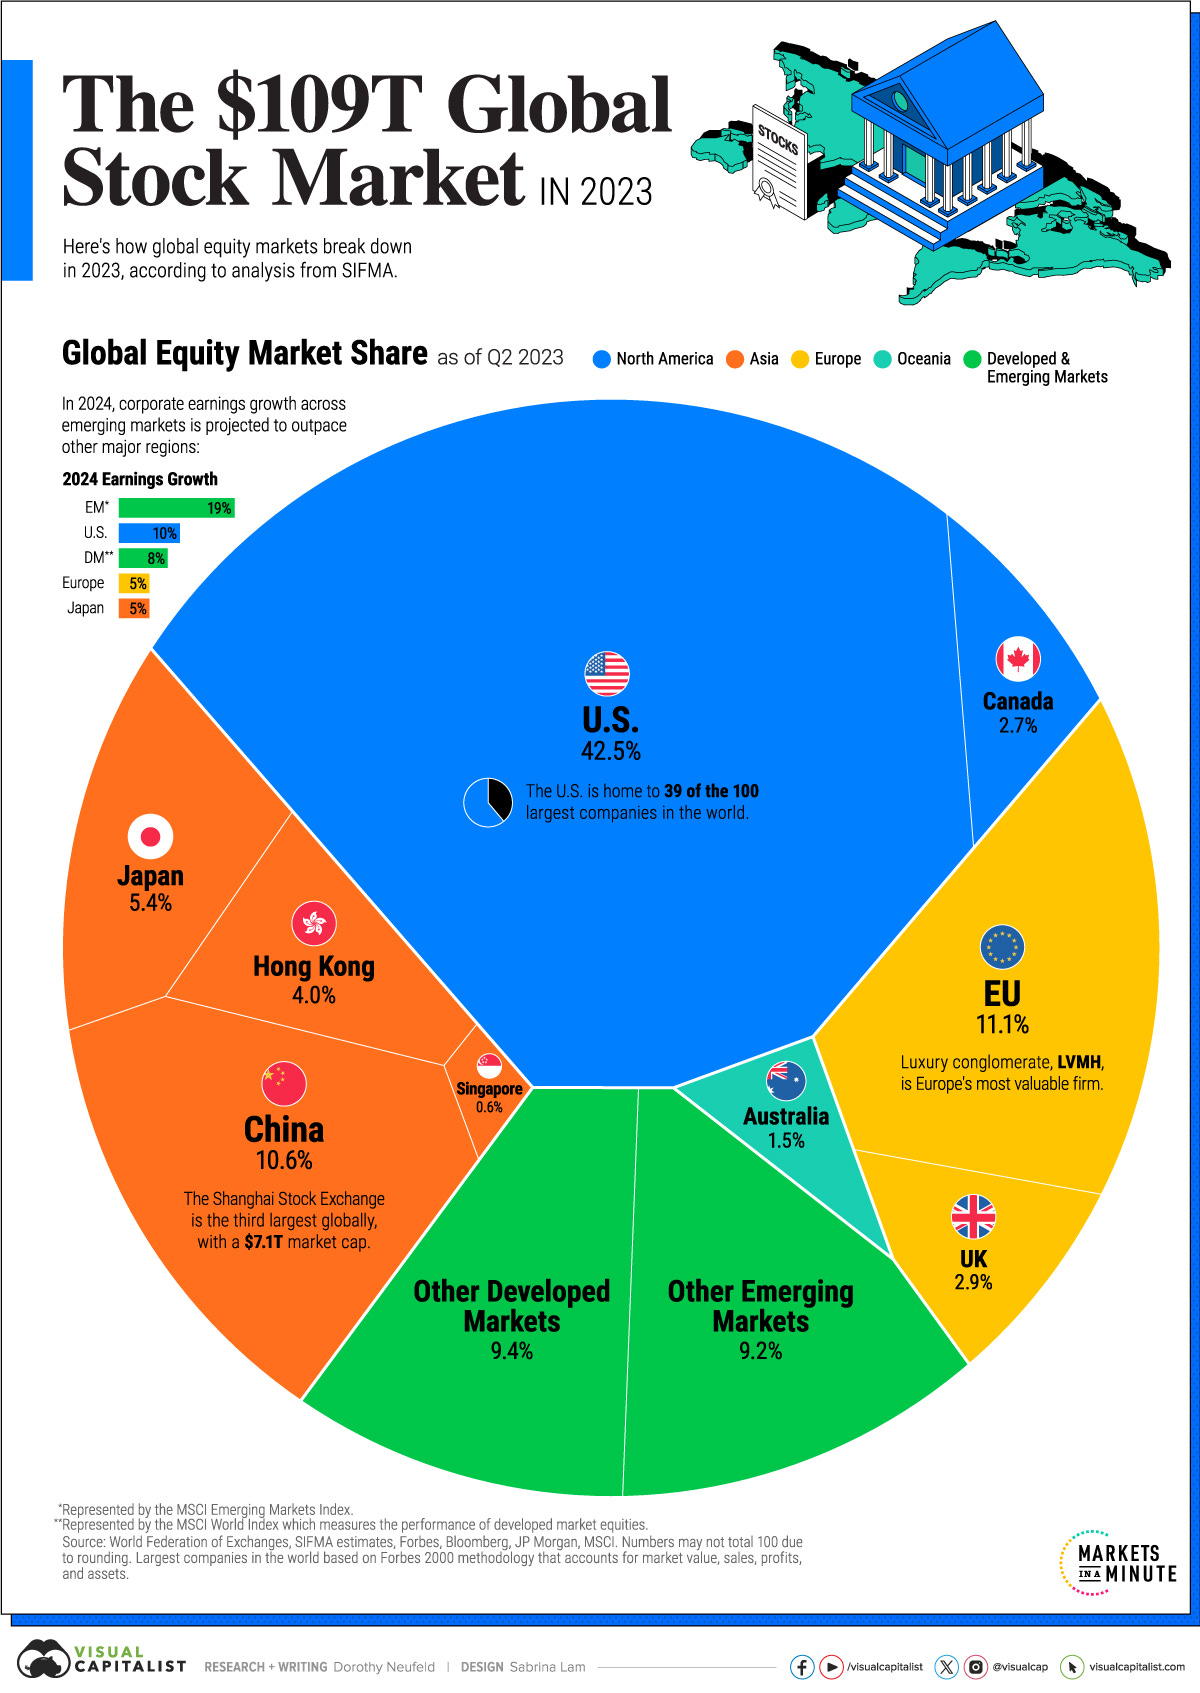
The U.S. accounts for more than 42% of the world market cap, compared to Europe's just over 13% (2023 data), despite both regions having roughly the same weight in global GDP. This significant market presence indicates greater growth potential and stability in the U.S. market.
U.S. vs Europe Investing Showdown (2/3)
Here’s what the last 20 years tell us about S&P 500 vs. Europe
The graph compares the S&P 500 and FTSE Europe Index indices from 2005 to 2024. The S&P 500 (white line) significantly outperformed FTSE Europe (orange line), growing by 373.54% compared to FTSE Europe's 39.57%.
Despite both indices dipping during the 2008 financial crisis, the S&P 500 recovered and surged, especially after 2013, while Europe remained relatively flat post-recovery. This illustrates the S&P 500's stronger performance and resilience over nearly two decades.
U.S. vs Europe Investing Showdown (3/3)
The Real Data Behind U.S. and European Productivity

Post-2008 financial crisis, U.S. companies and workers have shown a marked increase in productivity compared to their European counterparts. This enhanced efficiency can lead to better profitability and returns for investors in the S&P 500.
Investing in U.S. vs. Europe: The 2 Data Points You Must Know
Investing in the S&P 500 versus European markets is like choosing a quarterback based on two key factors: statistical performance and momentum.
The S&P 500, with its strong economic metrics and high productivity growth, represents a quarterback with stellar stats and positive momentum, indicating reliability and consistent success.
Europe, on the other hand, is akin to a quarterback with potential but facing negative momentum, struggling with uneven performance and economic challenges.
Balancing solid statistics with the positive momentum of the U.S. market and recognizing the potential turnaround amid negative momentum in Europe can help investors make a more informed and strategic decision.
Alpha Hedge Portfolio Performance Review
The Alpha Hedge Portfolio showed a monthly gain of +6.2%, leading to a year-to-date increase of +27.7%. Over the past 34 months, the portfolio achieved a cumulative growth of +50.5%, outperforming the S&P 500, which recorded a +27.0% increase over the same period.


