New Findings About This Bull Market Volatility
📶Decoding the S&P500: What is Maximum Adverse Excursion (MAE) | Alpha Hedge Portfolio Performance Review
Wall Street Insider Report
Decoding the S&P 500 Market Cycle and sharing the blueprint here in the Wall Street Insider Report.
Join +1.8k Wall Street Insiders across 55 countries.
S&P 500 TRACKER
New Findings About This Bull Market Volatility
On July 8, 2024, the S&P 500 was up about 17%. Despite impressive gains, the bull market has been notably uneventful.
Only 14 trading days saw gains of 1% or more. Small movements define this year's bull market.
Bear markets, however, are where excitement thrives. The 2022 bear market had numerous volatile days. Volatility clusters due to emotional investor reactions.
Understand these patterns to avoid overreacting in high-stress markets. Remember, markets won't stay calm forever; volatility will return.

In the last 30 days, the S&P 500 saw varied sector impacts. Health Care, Industrials, and Consumer Staples declined. Technology surged, impacting market cap significantly.
Consumer Discretionary also performed well. Financials and Communication sectors saw modest gains.
Overall, Technology drove market cap growth, highlighting sector performance divergence.
INSIDERS’ KNOWLEDGE HUB
What is Maximum Adverse Excursion (MAE)
Maximum Adverse Excursion (MAE) is a risk management metric used in investing to measure the largest drawdown or loss experienced from the entry point of a position to any point during the position before it is closed.
It helps investors assess the maximum potential risk they were exposed to during the trade, allowing for better evaluation and adjustment of their risk management strategies.
Understanding the Maximum Adverse Excursion (MAE) of the Alpha Hedge Portfolio
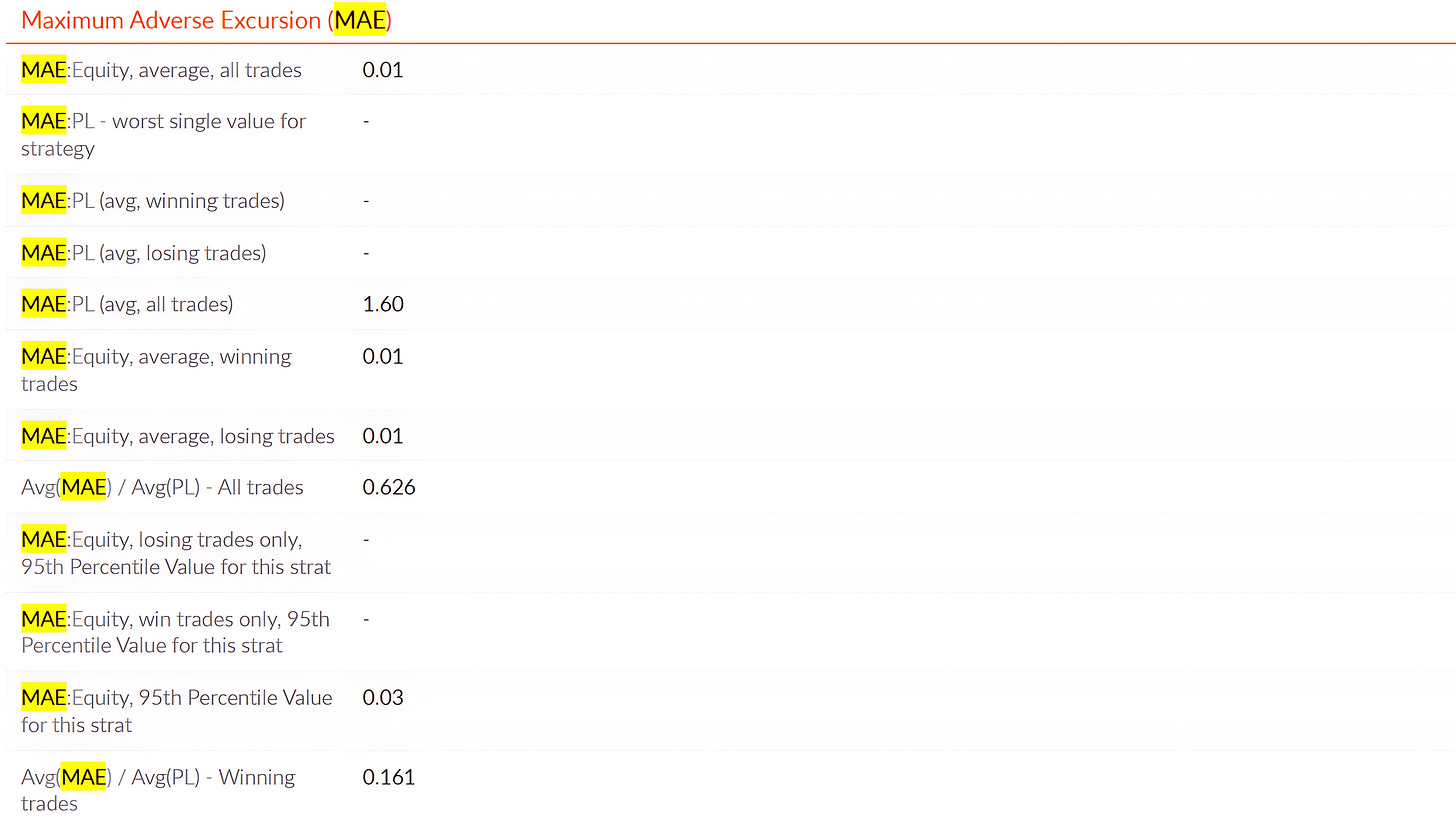
The average maximum adverse excursion for both winning and losing trades is low (0.01 units of equity).
The average adverse excursion in terms of profit/loss is 1.60 units.
The adverse impact on winning trades is relatively small (16.1% of the average P/L).
The 95th percentile value of MAE for all trades is low (0.03 units), suggesting most trades do not experience significant adverse movements.
Alpha Hedge Portfolio Performance Review
Are Historical Market Trends a Reliable Predictor?
Effectively all of our understanding of finance and investing is based, at least to some degree, on historical returns. But how good of a guide is the past? Is it actually different this time?
We’ve already talked about how we use statistics to analyze market behavior.
But at an even more fundamental level, how useful is all the historical returns data that we are swamped with?
Does knowing what happened in the past give us any useful information about what might happen in the future?
To spoil the story: yes, historical data is incredibly useful. You don’t want a quarterback with weak statistical performance in your team.
But you need to do so with the understanding that there is no precision in the data. Financial returns are noisy, and strange things happen. You need to take the historical data with a grain of salt (and a pretty big helping of humility).
By appreciating its limitations and understanding the broader context, we can better navigate the complexities of future market conditions.
The Alpha Hedge Portfolio has a monthly gain of 4.4% and a year-to-date increase of 25.5%. Over the past 34 months, the portfolio has achieved a remarkable return of 47.9%, significantly outperforming the S&P 500, which recorded a 25.9% increase during the same period.


