
Navigating Market Cycles with AI: A Real-World Case Study
Strategic Stock Analysis: Leveraging AI to Mitigate Market Risks

Navigating Market Cycles with AI: A Real-World Case Study
Yesterday I received this e-mail from a client:
Please see attached the companies I’d like your opinion on. Given that AI stock prices have plummeted from yesterday to today, is it worth investing in any of them at this moment
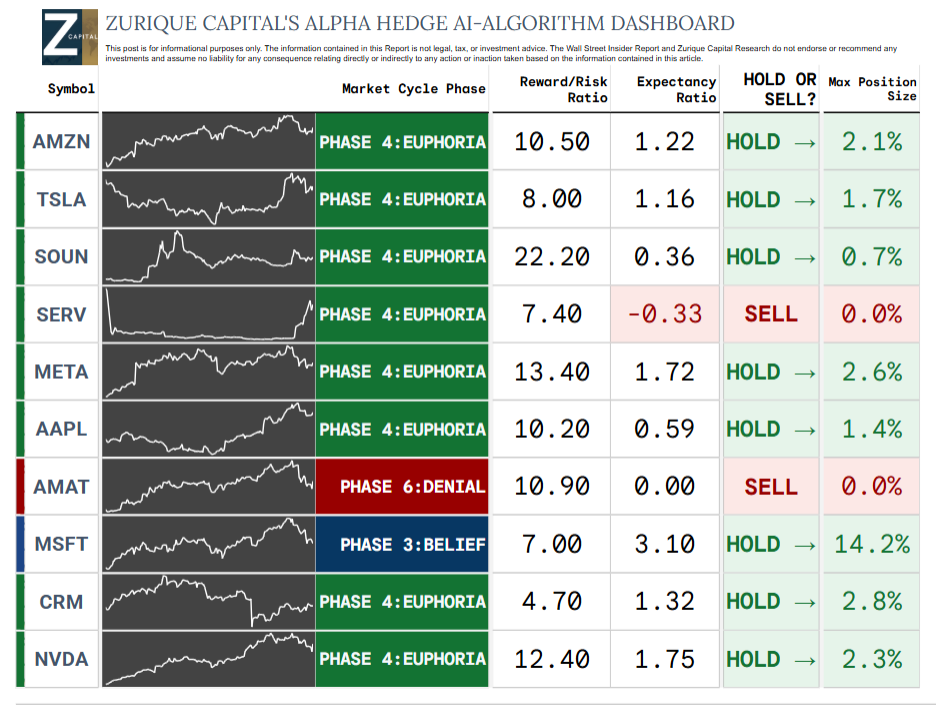
COMPANIES: AMZN 0.00%↑ TSLA 0.00%↑ SOUN 0.00%↑ SERV 0.00%↑ META 0.00%↑ AAPL 0.00%↑ AMAT 0.00%↑ MSFT 0.00%↑ CRM 0.00%↑ NVDA 0.00%↑
Alpha Hedge AI Algo Analysis
Investing is more than just numbers; it's about understanding the emotional rollercoaster investors ride through different phases of a market cycle. Let's delve into the psychology that drives these cycles and how AI can provide you with a significant edge.
Hope (Phase 1) – Strong companies gain institutional interest. Investors detect early price shifts and await trend confirmation.
Optimism (Phase 2) – Prices stabilize, hinting at a bottom. Investors buy if the month closes in this phase.
Belief (Phase 3) – Strong uptrend with high buying pressure. Best phase to buy for maximum returns.
Euphoria (Phase 4) – Media hype and retail frenzy drive rapid price gains. Investors hold positions from Phase 3.
Anxiety (Phase 5) – Momentum slows, signaling peak euphoria. Investors should prepare for potential downturns.
Denial (Phase 6) – Market reverses into a bearish cycle. Investors focus on risk management and capital preservation.

Market Cycle Chart The Alpha Hedge Algorithm is a beacon for navigating market volatility. It combines leveraged and protective assets to ensure that your portfolio thrives in any market condition. Let's break down the key components of this algorithm:
Alpha 1: Market Cycle Phase
Understanding the market cycle phase is crucial. Identifying the phase of the market cycle helps determine the optimal times to enter and exit positions. AI algorithms excel at detecting these phases, providing a significant advantage over traditional methods.
Alpha 2: Historical Performance Comparison
While past performance doesn't guarantee future results, it provides valuable insights into market behavior. The Alpha 2 indicator evaluates the asset’s historical performance through a risk-return analysis.
Alpha 3: Expectancy Ratio
The Expectancy Ratio is a cornerstone of the Alpha Hedge strategy. This mathematical principle calculates the probability of profit per dollar risked. A favorable Expectancy Ratio, combined with superior performance indicators, signals a green light for investment.
The Alpha Hedge Algorithm integrates three key indicators to determine the optimal position size for each asset in your portfolio. The stronger the quantitative data, the larger the allocated position, ensuring a data-driven approach to portfolio weighting.

▶️Read what the Wall Street Insiders wrote about us↓
Dan, your explanation about the Alpha Hedge algorithm and market cycles is truly fascinating and makes me believe that I can make more assertive investment decisions.
But to take the first step, where should I start? How can I deepen my understanding of the six phases of market cycles and their relationship with investor psychology?
What would be the best sources to study the Alpha Hedge algorithm and its main indicators? How to apply them in the analysis of the mentioned companies?
Furthermore, how can I determine which phase of the market cycle each company is in and how should this influence my investment strategy?
Finally, how should I align this analysis with my financial goals, risk profile, and investment horizon to make safer and more well-founded decisions?