


Demystifying Market Cycle Investing
An Essential Guide to Maximizing Returns in the Ever-Changing Market Landscape


Clique aqui para ler em português: https://www.wallstreetinsiderreport.com/p/ciclosdemercado
Seven17am #keypoints
Daily Educational [Free]
Introduction: Navigating the Market Cycle
Maximizing Returns: Investing Strategies for Different Market Phases
The Alfa Hedge Strategy
Portfolio Rebalancing
Bottom Line
Actionable Analysis [Premium]: Market Cycle Update
Building Wealth [Premium]: Real-Life Brokerage Account Long-Term Portfolio Positions
Introduction: Navigating the Market Cycle
Investing in the stock market can be both exciting and challenging.
With the market cycle constantly evolving, it's crucial to understand the dynamics at play and adapt your investment strategies accordingly.
This guide aims to equip you with the knowledge and tools necessary to navigate the market cycle effectively and make informed investment decisions that align with the ever-changing market landscape.
Maximizing Returns: Investing Strategies for Different Market Phases
Understanding the Market Cycle
Before delving into specific investment strategies, let's first grasp the concept of the market cycle.
The market cycle refers to the recurring patterns and phases that the stock market undergoes over time.
These phases include the bull market, bear market, recovery, and consolidation. By understanding these market phases, investors can gain insights into potential investment opportunities and adjust their strategies accordingly.
After more than 10 years in the market and validations through backtests spanning 30 years, I have developed the Alfa Hedge, based on the trading systems of Stan Weinstein, Nicholas Darvas, and Curtis Faith.
All assets go through 6 Price Cycle Phases.


In the world of investing, understanding price cycles is crucial for making informed decisions and maximizing returns.
The Alfa Hedge Strategy is built upon the foundations of renowned trade systems developed by Stan Weinstein, Nicholas Darvas, and Curtis Faith.
By recognizing and analyzing the six distinct phases of price cycles, this strategy aims to help investors navigate the market more effectively. Let's delve into each phase and explore the corresponding investment approaches.
PHASE 1: Institutional Phase
During the Institutional Phase, prices recover after a significant decline, and smart money starts accumulating positions.
Key characteristics of this phase include a shift from selling to buying pressure. Investors can take advantage of this phase by:
Spotting Early Signs: Look for price price shift from a Downtrend to an Uptrend.
Identifying Promising Stocks: Focus on fundamentally strong companies with attractive growth prospects and increasing institutional interest.
Wait for the Uptrend Confirmation: Anticipation of the upcoming uptrend can be a problem, and cause severe losses, so, the investor should wait for the Uptrend confirmation.
PHASE 2: Basis Phase
Also known as the Accumulation phase, focuses on the characteristics and behavior of stock prices during this stage of the price cycle.
In Phase 2, stock prices stabilize after a significant decline, indicating a potential bottoming process. This are the key points regarding Phase 2:
Price Consolidation: Phase 2 is characterized by a period of price consolidation, where price stabilize after a downtrend. This consolidation often takes the form of a basing pattern, such as a sideways range or a rounding bottom.
Decreasing Selling Pressure: During Phase 2, there's a shift from selling to buying pressure that drove the initial decline. This reduction in selling pressure is an indication that the downtrend may be coming to an end.
PHASE 3: Wall Street Insiders Phase
In Phase 3, the Market is rising steadily, indicating a strong uptrend. this are the key points regarding Phase 3:
Strong Uptrend: Phase 3 is characterized by a robust uptrend in the Market. This indicates a period of increasing buying pressure in the market.
Higher Highs and Higher Lows: During Phase 3, the Market consistently reach higher highs and higher lows, reflecting the upward momentum and strength of the trend. This pattern confirms the positive price action and reinforces the uptrend.
Confirmation through Technical Indicators: The buying signal is set when there is a higher potential for returns and lower risk
Buying and Holding Positions: In Phase 3, investors are advised to ride the uptrend by buying and holding positions. The goal is to maximize returns as the market prices continue to rise.
Trailing Stop Losses: A trailing stop loss during Phase 3 to protect profits and manage risk in case of an abrupt reversion of the market. This strategy allows investors to secure gains while still giving the stocks room to grow, capturing potential further upside.
PHASE 4: The Public Phase
The Phase 4 refers to a stage in the life cycle of the market where widespread public participation and enthusiasm.
During this phase, the general public, including retail investors, starts showing significant interest and participation in the Market, contributing to its rapid price appreciation.
Key characteristics of the "public" phase include:
Hype and Media Attention: Themarket gains widespread media coverage, attracting the attention of the general public. News outlets, social media, and various communication channels amplify the hype and generate excitement around the asset.
Increased Retail Investor Participation: More individual retail investors, who may not have extensive investment experience, enter the market driven by FOMO (Fear of Missing Out) and the belief that they can profit from the asset's remarkable performance.
Speculative Behavior: Speculative behavior becomes prevalent, with investors often disregarding fundamental factors or valuations. Instead, they focus on the potential for further price increases and join the trend driven by the fear of being left behind.
Excessive Optimism and Euphoria: Market sentiment reaches a peak of optimism and euphoria. Investors may exhibit overconfidence and expect the asset's price to continue rising indefinitely, leading to irrational exuberance.
Rapid Price Appreciation: The asset experiences significant price increases, often at an unsustainable pace. Prices may detach from underlying fundamentals, and valuations may become stretched.
Larger Investment Firms and Institutions Exiting: As the bubble reaches its public phase, larger investment firms and institutional investors who were early participants in the asset may start reducing their positions or even exiting altogether, taking profits while the retail frenzy continues.
It's important to note that the Phase 4 of the Market is typically seen as a warning sign of a potential market correction or reversal. The excessive optimism and speculative behavior can lead to a significant sell-off ahead.
PHASE 5: The Top Phase
Also known as the Distribution phase or the Top, focuses on the characteristics and behavior of prices during this stage of the price cycle.
In Phase 5, the uptrend starts losing momentum, indicating a potential market top. Key points regarding Phase 5:
Weakening Uptrend: Phase 5 is characterized by a weakening uptrend in stock prices. The pace of price appreciation slows down, and the upward momentum starts to fade. This indicates a shift in market dynamics and a potential exhaustion of buying pressure.
Price Consolidation and Narrowing Ranges: As the uptrend loses steam, stock prices may consolidate within a narrower range. This consolidation pattern often forms a distribution area where supply starts to match or exceed demand.
Distribution Signs: Signs of distribution become more evident during Phase 5. These signs may include the presence of institutional selling, large sell orders, and resistance to further price increases despite positive news or market developments.
PHASE 6: The Decline Phase
Also known as the Bear Market phase or the Top Reversal. In Phase 6, the market undergoes a significant reversal from the previous uptrend, indicating a transition into a bearish environment. Key points regarding Phase 6:
Bearish Price Action: Phase 6 is characterized by a sustained decline in stock prices, marking the end of the previous uptrend. The bearish price action is accompanied by lower highs and lower lows, reflecting the overall downward momentum.
Increasing Selling Pressure: During Phase 6, selling pressure becomes dominant, leading to a cascade of sell orders. Investors who were holding positions from the previous uptrend identificate the Selling Point and start selling to protect their gains or limit their losses.
Breakdowns and Technical Weakness: Breakdowns below key support levels and technical weakness become more prevalent during Phase 6. These breakdowns can trigger additional selling and further exacerbate the downward price movement.
Prudent Risk Management and Capital Preservation: In Phase 6, investors should prioritize prudent risk management and focus on capital preservation. This may involveconsidering defensive strategies such as hedging or moving to cash.
The Alfa Hedge Strategy
Investing in the Bull Market: Seizing Opportunities
During a bull market, the stock prices are rising, and investor confidence is high.
This is a period of optimism and growth, presenting excellent opportunities for investors. We call this the Positive Cycle (Phases 3, 4 and 5)

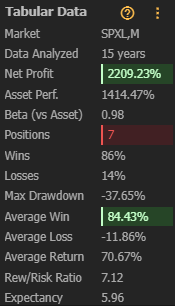
We amplify this moment with Leverage ETFs, such as the SPXL Direxion Daily S&P 500 Bull 3X Shares.
We limit our losses we benefit the potential upside of this asset.
As shown, in the last 15 years (from Nov/08 to Jun/23), using the market cycle phase analysis to enter and exit the positions on SPXL, reinvesting profits, the result was 2.209.23%.
If you had only bought and hold the S&P 500 ETF SPY in the same period the result would be 328.64%.
Navigating the Bear Market: Defensive Approaches
In a bear market, stock prices decline, and pessimism prevails. This can be a challenging time for investors, but with the right strategies, you can protect your investments and even capitalize on the situation.
Cash is king during the Bear Market, so, Floating Rate Assets, as USFR WisdomTree Floating Rate Treasury Fund ETF is one possible risk management strategy during the Negative Cycle (Phases 6, 2 and 1).
USFR launched just weeks after the first floating-rate Treasurys (or FRNs) came to market in early 2014.
The fund selects FRNs that have a two-year term that have an issue date on or before the index rebalancing date. As FRNs reset their coupon rate weekly based on the most recent 90-day T-bill auction (interest is paid quarterly), they offer an extremely low-risk place to park one’s cash with minimal interest-rate sensitivity, which should appeal to those concerned about potential rising rates.
Of course, that also means reinvestment risk and low returns should rates fall. The index is rebalanced on the last business day of every month.
Also, some markets as Dollar Index, Treasures or Gold can be alternatives during Bear Markets. Let’s dive into this.
How to Build a Dynamic Portfolio in Wall Street
In the last 10 years, our clients have outperformed the American market through our Proprietary Investment Strategy.
Now you will have access to the fundamentals of the Alfa Hedge Portfolio.
Establish the universe of assets of the Alfa Hedge Portfolio
Dynamic capital diversification allows the Investor to take advantage of Positive Market Cycles with Controlled Risk.
This form of diversification allows for greater predictability of results and consistent returns over the years, with reduced risks.
Traditional portfolios offer constant allocation to a universe of Assets.
However, the returns from these investments can be variable under different market conditions. The winners "carry" the losers.
Dynamic diversification allows for more stable returns, as the allocation of Assets is determined by the market cycle and its historical volatility.
The Myth of Diversification
"Put all your eggs in one basket, and watch that basket."
MAX GUNTHER
You don't go to the beach when it's cold and raining, do you? By following theAlfa Hedge Portfolio, you will end up knowing when it is riskier and it is essential to keep a close eye on all the Assets you already own.
An important point in managing the Alfa Hedge Portfolio is to find the sweet spot of diversification. Within our algorithm, we currently filter the Assets within a set of markets.
But the main difference of the Alfa Hedge Portfolio from the assembly of traditional Portfolios is that in it, you don't need to be with all Asset classes at the same time in the Portfolio. You eliminate the "losers" and keep the "winners".
The key is to react of what is happening on the Market Cycle, not try to predict.
Look at the chart below. It shows the period in which each of the markets was in a Positive Market Cycle and present in the Alpha Wall Street Portfolio from 2013 to 2022.

Observe the example from January to November 2013.
1. In January 2013, Markets 4, 5, and 6 were in our Portfolio.
2. In April '13, Market 2 entered a Positive Cycle and consequently entered the Portfolio.
3. In July '13, Market 6 entered a Negative Cycle, and consequently, we closed the position.
4. In October '13, it was Market 2's turn to close the position, leaving only Markets 4 and 5 in the Portfolio.
THE ALFA HEDGE PORTFOLIO II

ALFA HEDGE PORTFOLIO I


There is a concept of "think, wait, and fasting" from the book "Siddhartha" by Hermann Hesse can be applied to the stock market in the following way:
Think: Before making any investment decisions, it is essential to engage in thoughtful analysis and research. "Thinking" in the stock market context involves studying the market cycle. This process also includes considering your investment goals, risk tolerance, and overall investment strategy.
Wait: After conducting thorough research and analysis, it is important to exercise patience and practice the concept of "waiting" in the stock market. This means avoiding impulsive or hasty decisions based on short-term market fluctuations or emotions. Instead, it involves waiting for the right opportunity to enter or exit a position accordingly with de market cycle. Waiting allows you to observe market trends, monitor the performance of the assets you are interested in, and wait for favorable price levels or confirmation of market trends before taking action.
Fasting: fasting refers to abstaining from actions. In the stock market, it can be applied by refraining from trading when there is a lack of clear signals. It involves exercising self-discipline and resisting the urge to engage in excessive buying or selling based on short-term market noise or fluctuations. Fasting allows you to avoid making impulsive decisions that may lead to unfavorable outcomes and instead maintain a long-term perspective.
Portfolio Rebalancing
We keep our positions for months or years. So on the first monday of each month we check the Phase of each one of the markets in our watchlist and assemble (or not) accordingly our risk management position sizing algorithm.
Bottom Line
Utilizing market cycles with a trend following overlay is a strategy that combines the insights from market analysis with the discipline of trend following.
By identifying the phase of the market cycle and aligning investments with prevailing trends, investors can potentially enhance their returns and manage risk more effectively. However, it is important to note that no investment strategy is foolproof, and thorough research, risk management, and regular monitoring are essential components of successful investing.
In the last 10 years We've been building Portfolios to overtake the Market demystifying the Market Cycle and investing smarter.
Become a Premium member and receive:
◾Daily Educational: Demystifying Market Cycle Investing in Wall Street
◾Actionable Analysis: Market Cycle Update
◾Building Wealth: Real-Life Brokerage Account Long-Term Portfolio Positions
◾Insiders Live: Watch the Monthly Portfolio Rebalancing Live
Access Now 👇 or Click on the Button below to know more about Premium Subscription