
📊Key Economic Indicators for the S&P500
Decode the S&P 500 Market Cycle

Wall Street Insider Report
Decoding the S&P500 Market Cycle and sharing the backstage here in the Wall Street Insider Report.
Join +1.5k Wall Street Insiders across 30 US states and 51 countries.
Key Economic Indicators for the S&P 500
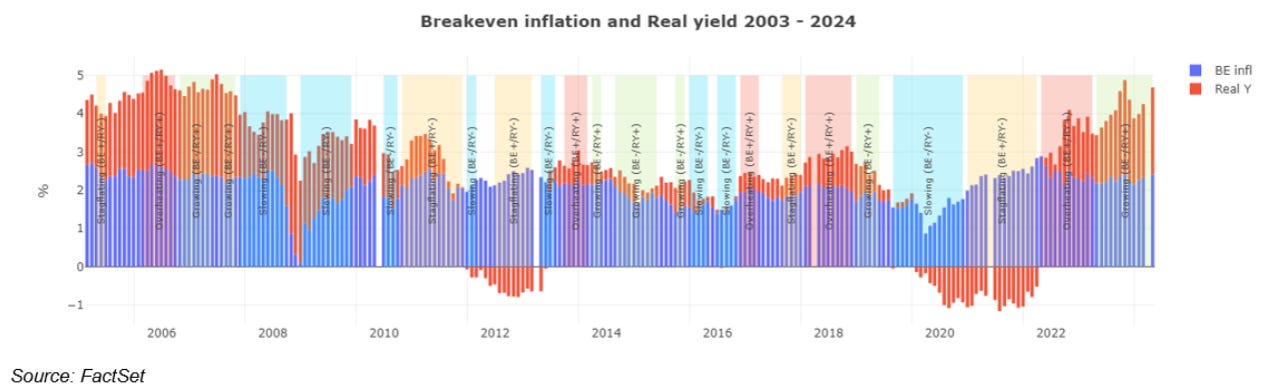
In today’s volatile economic climate, understanding the factors influencing the S&P 500 returns is vital. This includes how breakeven inflation (BE) and real yields (RY) affect equity performance.
BE inflation is derived from the difference between 10-year nominal and real yields, while RY represents yields on 10-year Treasury Inflation-Protected Securities (TIPS).
The regimes include Growing (BE+/RY+), Overheating (BE+/RY+), Slowing (BE-/RY+), and Stagflation (BE-/RY-).
Understanding the impact of breakeven inflation and real yields on S&P 500 performance enables investors to make informed allocation decisions amidst changing economic environments.
Data from January 2003 to April 2024.
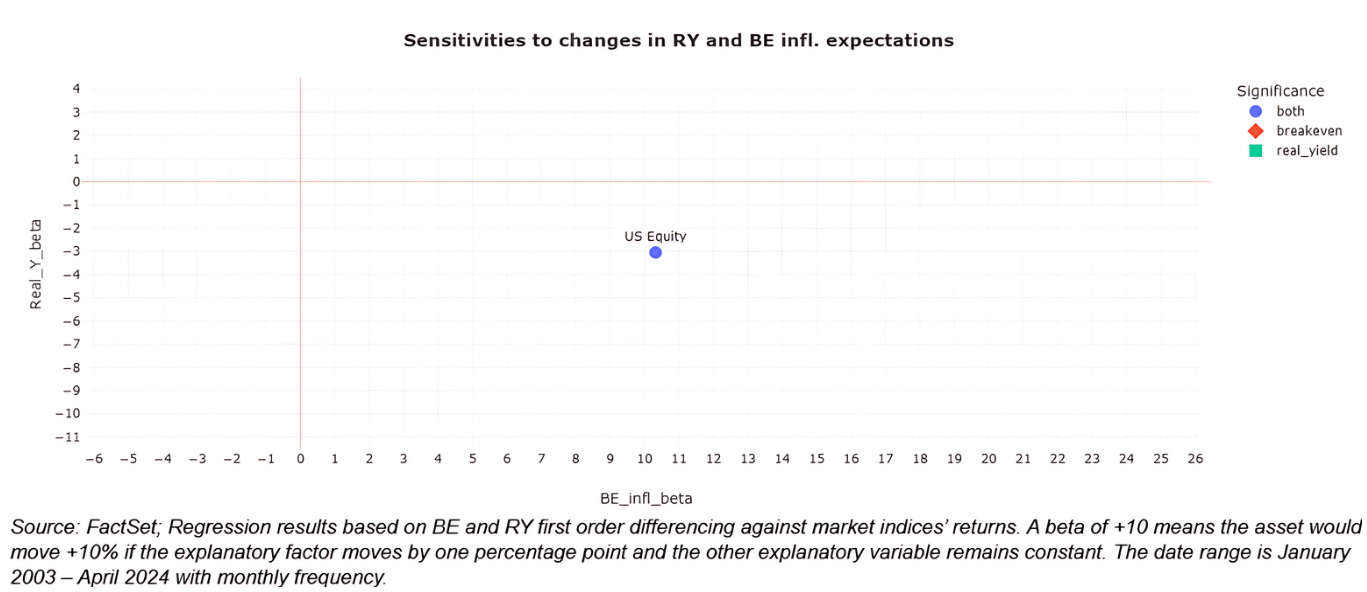
The Economic Regime with the Greatest Impact on the S&P 500
The sensitivity plot illustrates how the S&P 500 respond to different economic regimes categorized by breakeven inflation (BE) and real yields (RY).
The S&P 500 is positively affected by changes in inflation expectations, with the overheating regime being the most significant where both variables markedly impact the asset class.
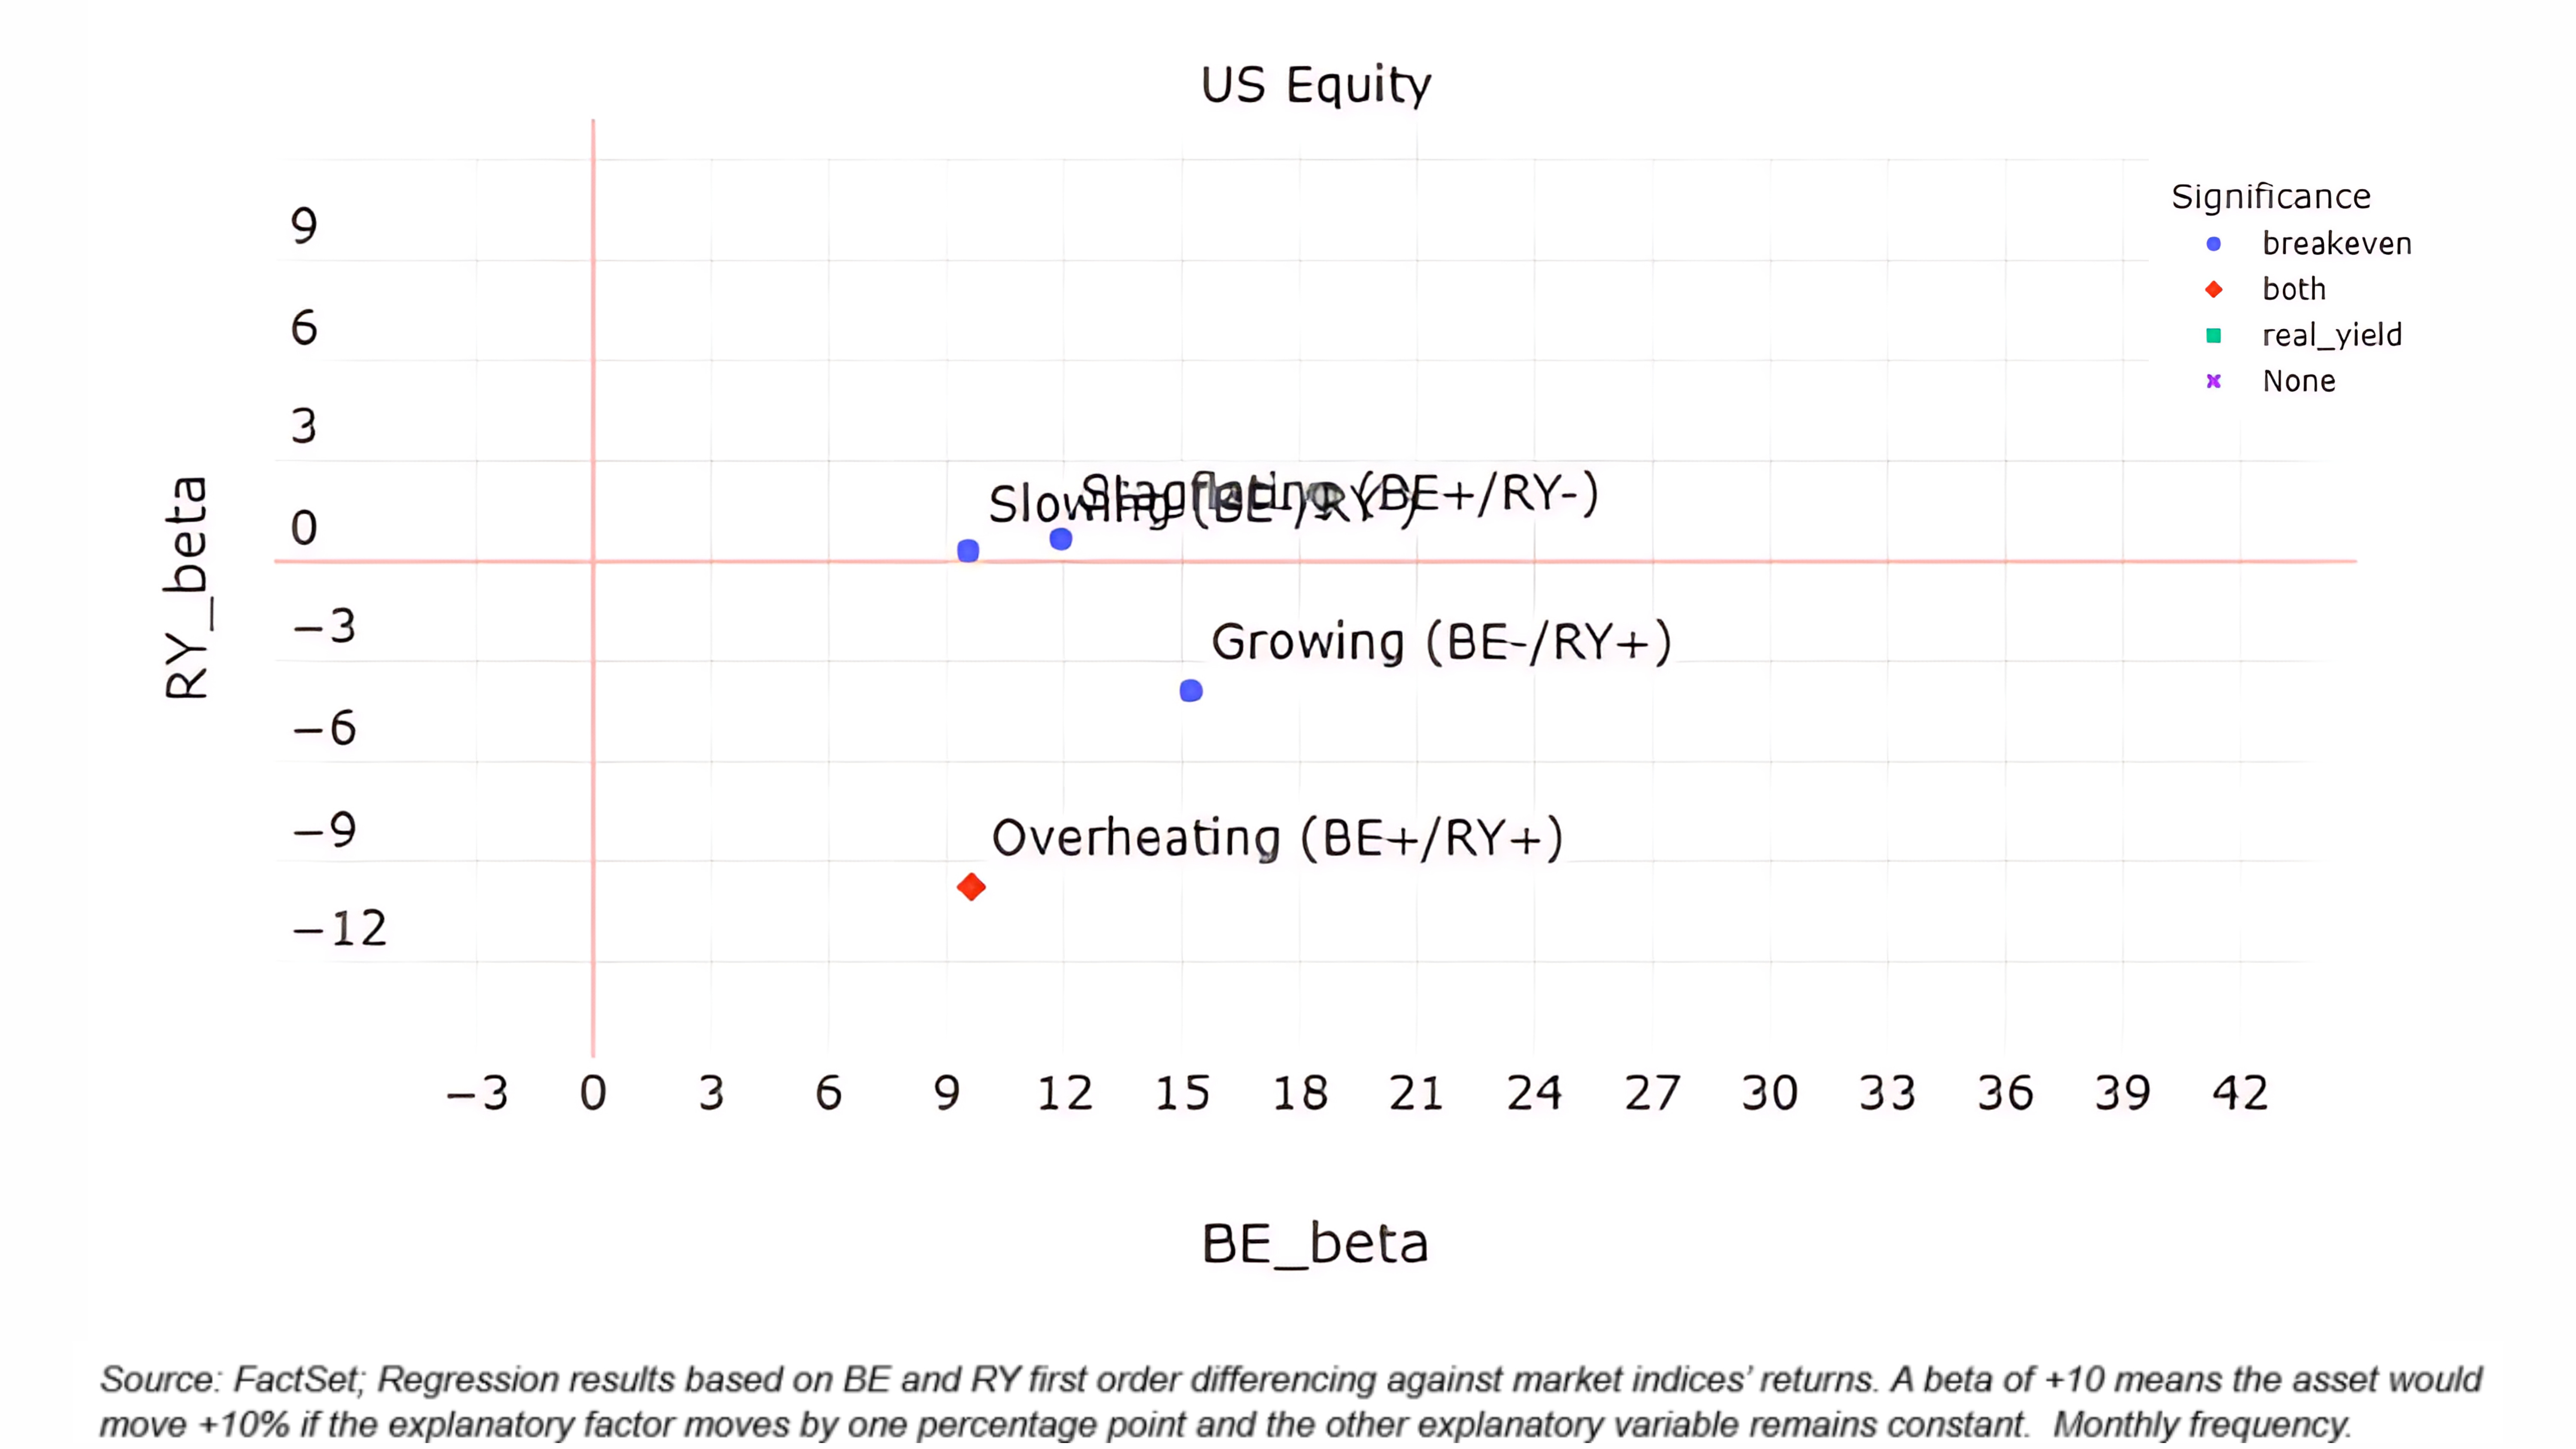
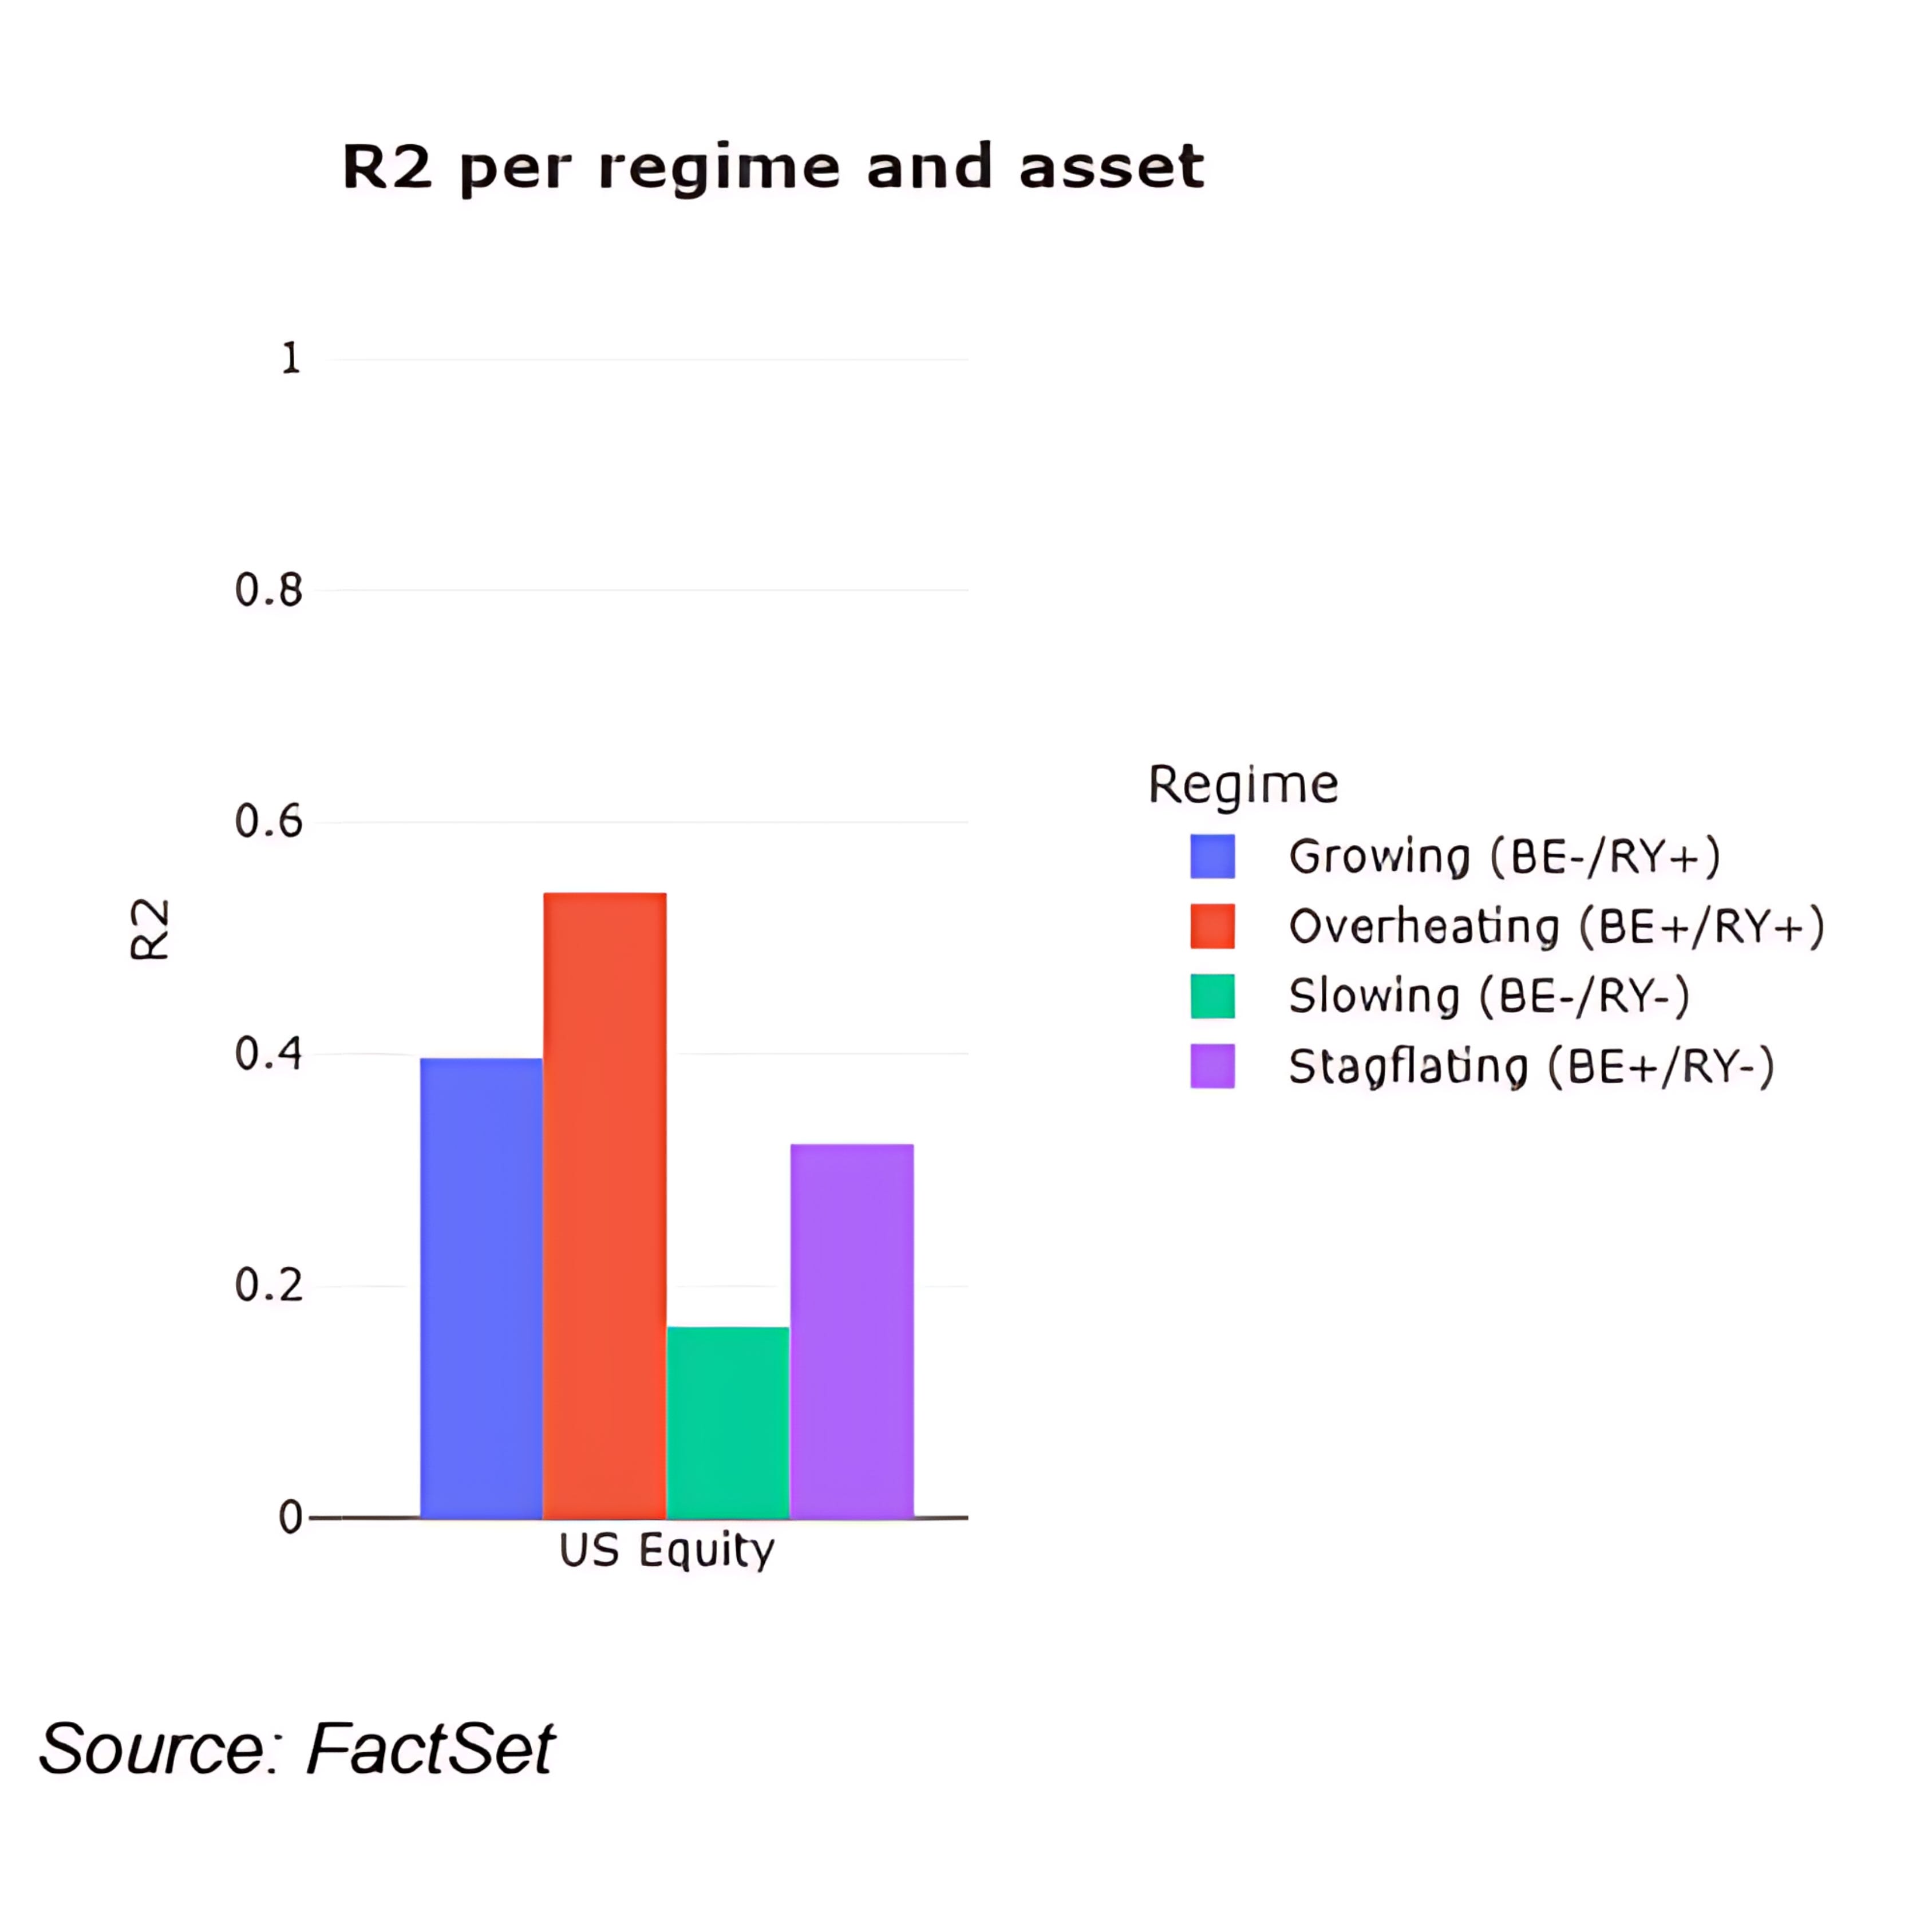
The sensitivity analysis also shows that the S&P 500 reach their peak R2s during overheating and growing regimes, respectively.
R-squared (R2) is a statistical measure that represents the proportion of the variance in a dependent variable that is predictable from the independent variables. It indicates the strength of the relationship between the model and the dependent variable, with values ranging from 0 to 1. An R2 value of 1 means the model perfectly explains the variance, while a value of 0 means it does not explain any variance. In finance, a higher R2 value indicates that a greater proportion of asset returns are explained by the economic factors being analyzed.
This Will Change How You Think About S&P 500 Returns Across All Economic Regimes
The analysis reveals that the S&P 500 exhibit positive mean returns across all economic regimes.
This outcome is partially contradictory, considering the varying betas toward the two explanatory variables (BE and RY).
This suggests that despite the influence of these factors, the equities maintain positive performance due to other underlying supportive economic or market conditions.
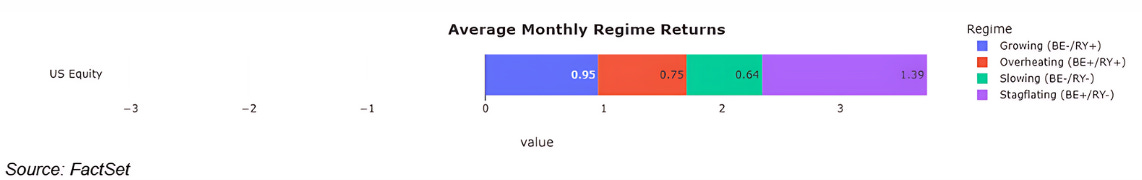
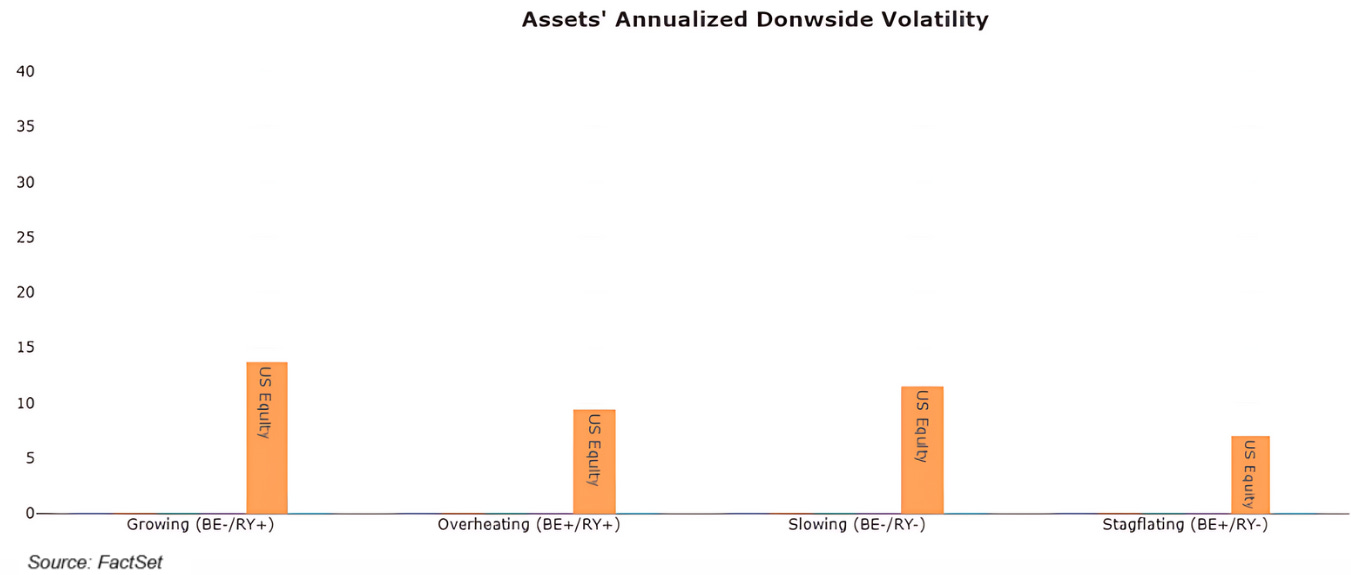
These Are the Most Volatile Economic Scenarios for the S&P 500
Volatility analysis shows that the S&P 500 have relatively low deviation in overheating and stagflation regimes.
However, they become much more volatile during growing and slowing scenarios. This indicates that while equities can maintain positive returns across all regimes, their risk profile varies significantly, demanding careful consideration in allocation strategies.
New Data: How the S&P 500 Relates to Inflation and Yields
The all-time sensitivity plot underscores the overall relationship between the S&P 500 returns and the economic factors of BE and RY.
Over the long term, US equities, exhibit a meaningful correlation with both variables.
The positive correlation with BE indicates that inflation expectations significantly influence performance, while the negative correlation with RY suggests that higher real yields can dampen equity returns.
Conclusion
The analysis of BE inflation and RY provides valuable insights for the S&P 500 allocation in changing economic environments.
By understanding these relationships, investors can better position their portfolios to mitigate risks and capitalize on opportunities.
This understanding enables investors to navigate complex market conditions and optimize their asset allocation strategies effectively.
References
FactSet. (2024). Asset Class Analysis and Allocation Implications in Changing Economic Environments. Link
Portfolio Review: 06/13/2024
The Alpha Hedge Portfolio experienced a gain today, reflecting the overall performance of the S&P 500, which rose by +0.2%.
This positive movement contributes to the portfolio's monthly performance, which now stands at a +5.6% increase.

Over the past decade, our subscribers have outperformed the American Market Decoding the S&P 500 Market Cycle.
You too can make investment decisions based on objective data.
That's where the Wall Street Insider Report comes in. We've developed a unique approach to investment management that puts you back in the driver's seat.
Know more about our 5-Year Plan and join +1.5K Pro Investors and Finance Professionals across 51 countries who are exponentially growing their - and their clients - wealth for over a decade.↓