


July/24: Monthly Alpha Hedge Portfolio Allocation Update
July/24 Portfolio Alpha Hedge Rebalancing

July/24: Monthly Alpha Hedge Portfolio Allocation Update
The prevailing culture in the investment world is that the best is the one who predicts highs and lows. Daily at Zurique Capital, we are asked whether the S&P 500 will rise or fall.
Although this is a pertinent concern for investors, our investment methodology is grounded in systemic market cycle analysis and probabilistic trend analysis.
With this approach, we transcend the analysis of bull and bear markets, because our portfolio will automatically react to these conditions.
We believe that emotional attachment to market movements—be it optimism, pessimism, or other subjective judgments—can lead to ego-driven decisions that are counterproductive.
Our Market Cycle / Trend Following approach is not about making bold predictions. It is about maintaining a clear, adaptable plan that can be applied consistently, regardless of market conditions.
In June, the S&P 500 is in Phase 4 of the Market Cycle.

The positions in the Alpha Hedge Portfolio for the equities market will be maintained in July, marking 6 months without any position adjustments.
The Alpha Hedge Portfolio will remain overweight in RISK-ON MODE.
Allocations will stay at MODERATE RISK-ACCEPTANCE MODE (51% exposure) as we transition from June to July.

Decoding June’s S&P 500 Landscape
In June, the markets presented several outliers, that could have triggered rash decisions without a systematic plan:
The S&P 500 and artificial intelligence stocks reached new highs.
The pronounced divergences between large-cap and small-cap stocks.
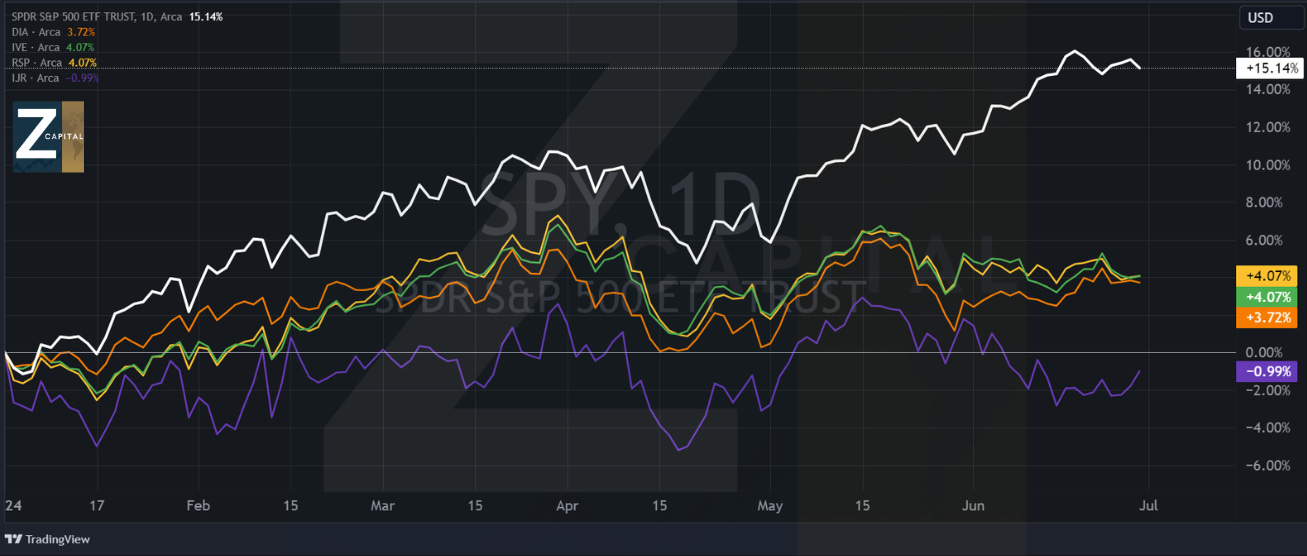
As we reach the halfway point of 2024, the S&P 500 Index has shown impressive performance:
Up over 15% year-to-date (white line). SPY 0.00%↑.
Increased in five of the six months this year.
Increased in seven of the last eight months overall.
However, a closer look reveals significant disparities within the index and across U.S. stocks more broadly:
The Dow Jones Industrial Average DIA 0.00%↑ (orange line) is up 3.72% YTD.
S&P Value stocks IVE 0.00%↑ (green line) are providing roughly about 4%.
S&P Small-cap stocks' IJR 0.00%↑ (purple line) performance is underwhelming, decreasing -0.99% YTD.
An equal-weighted measure of the S&P 500 (yellow line) RSP 0.00%↑ shows a return of about 4%.
Fixed Income
The US 10-year rate has shown a decrease in the last 2 months, but the uptrend is still maintained.
Fixed Income position will also be maintained in July
Alpha Hedge Portfolio Result June/2024
09/17/2021 to 06/29/2024
Alpha Hedge Portfolio Result June/2024: +6.3%
Alpha Hedge Portfolio Result 2024: +20.3%
Since we publicly shared the evolution of our portfolio, the Alpha Hedge Portfolio has grown significantly, with its value reaching $70,846 from the original investment of $50,000, a 41.69% gain in 33 months.
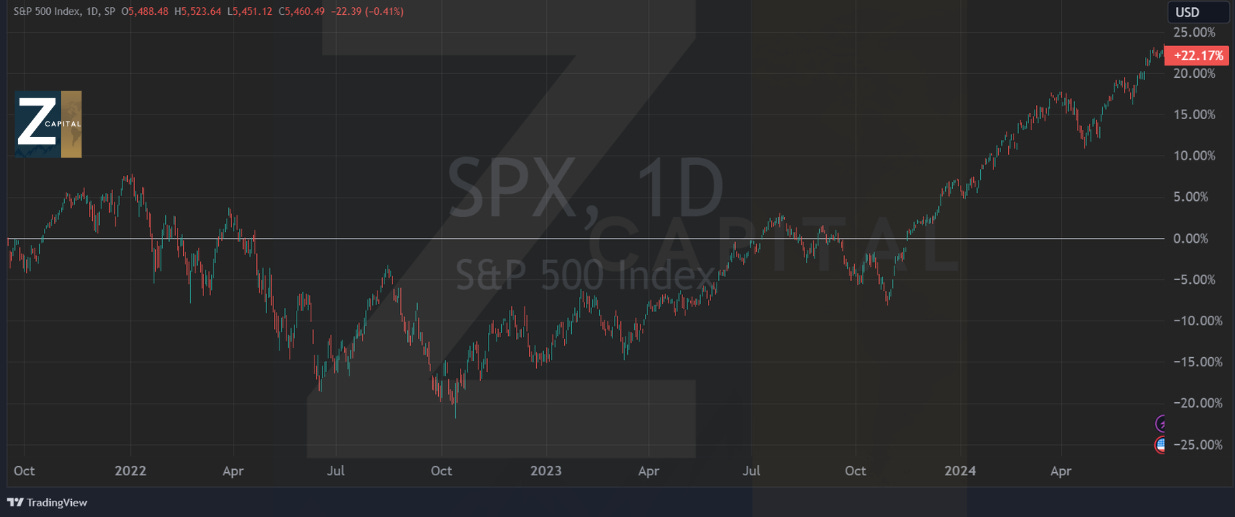
The S&P 500 had a gain of 21.17% in the same period.
After analyzing the performance of the Alpha Hedge Portfolio, here are the key takeaways:

Annual Return (Compounded): The Alpha Hedge Portfolio has achieved a remarkable 13.3% compounded annual return since its inception on September 17, 2021.
Win Trades and Win Months: The portfolio has a win rate of 53.6% in trades and 58.8% in profitable months.
Profit Factor: The portfolio boasts a profit factor of 4.3:1, which means the gains are 4.3 times the losses.
Correlation with S&P 500: With a correlation of 0.084 to the S&P 500, the portfolio exhibits low correlation, indicating its potential as a diversification tool within a broader investment strategy.
Sharpe and Sortino Ratios: The Sharpe Ratio of 0.75 and Sortino Ratio of 1.10 reflect the portfolio's risk-adjusted returns.
Beta and Alpha: The portfolio's beta of 0.06 suggests low market sensitivity, while an alpha of 0.03 indicates its ability to generate excess returns above the market benchmark.
Understanding the Collective2 Portfolio
The Collective2 Portfolio was established on September 17, 2021, with an initial investment of $50,000 to ensure confidence in the presented results. This Platform allows our Premium Subscribers to access the Alpha Hedge Portfolio in real-time and join us on our journey to increase our portfolio tenfold within a decade.
⚠️*We execute the Alpha Hedge Strategy in a Real-Life Brokerage Account with Interactive Brokers integrated with the Platform Collective2, a U.S. regulated company based in New York.
This way, to ensure confidence in the presented results, we enable Premium Subscribers access to our positions in real time.
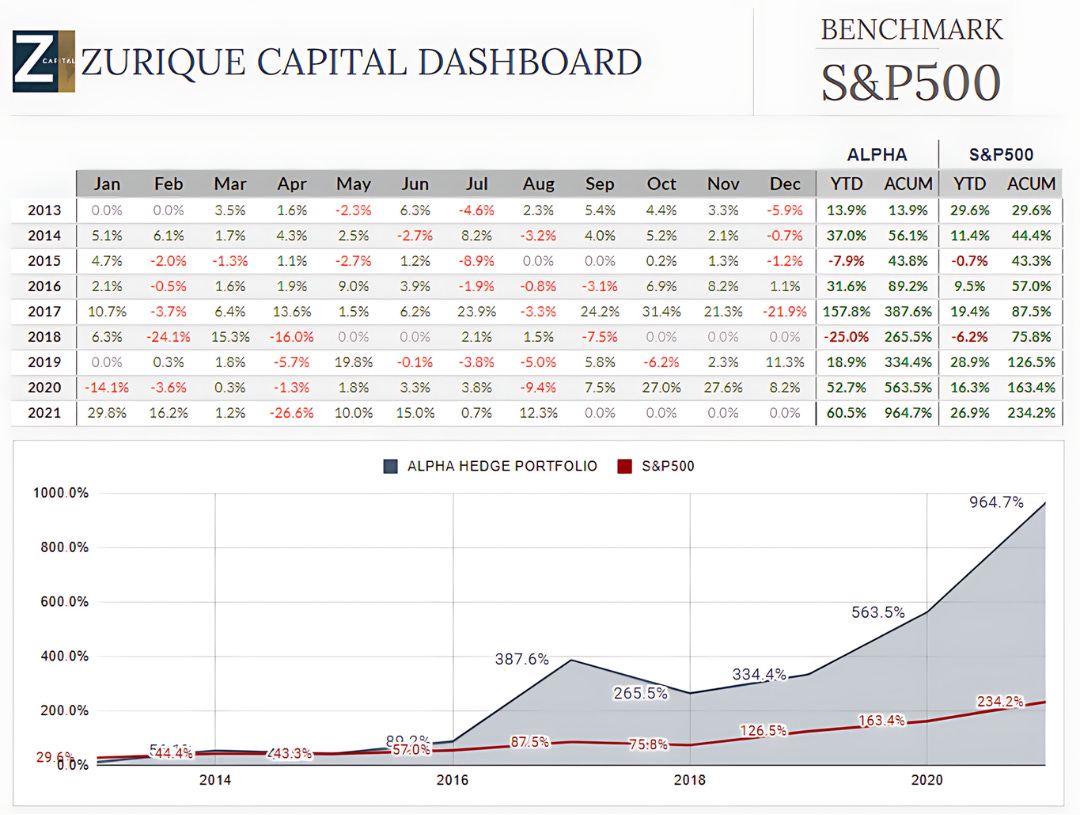
Alpha Hedge Portfolio Historical Data
2013 to 09/17/2021
In 2021, the Alpha Hedge Portfolio increased 10x, yielding a 967% return on the initial investment. This was achieved without any new contributions or withdrawals, with profits reinvested and dividends excluded throughout the period.
Unlock the Alpha Hedge Portfolio ↓