3 Critical Components of a Strong AI Investment Strategy
📶Decoding the S&P500
Wall Street Insider Report
Decoding the S&P 500 Market Cycle and sharing the blueprint here in the Wall Street Insider Report.
Join +1.8k Wall Street Insiders across 55 countries.
INSIDERS’ KNOWLEDGE HUB
3 Critical Components of a Strong AI Investment Strategy
Staying ahead with an investment strategy requires a keen understanding of the challenges posed by AI advancements and a strategic approach to overcoming them.
Embracing a quantitative investment methodology can provide the necessary tools and insights to navigate these complexities effectively, ensuring sustained growth and competitiveness.
Top Pitfalls in Financial Services AI Adoption
Short-Term Focus: Many investors prioritize immediate issues over long-term strategic planning, missing out on transformative opportunities.
Market Cycle Myopia: A lack of agility can stifle market expansion and adaptability to cycles changes.
Overwhelmed by Change: The rapid pace of AI advancements leaves many investors feeling overwhelmed, leading to inaction or poorly executed strategies.
Proactive Strategies for Navigating AI in Financial Services
Embrace Long-Term Strategic Planning: Shift focus from short-term issues to long-term goals, ensuring a sustainable approach to digital transformation..
Enhance Market Cycle Agility: Develop a keen understanding of markets and adapt strategies to navigate market shifts effectively.
Structured AI Adoption: Implement AI systematically within investment strategies, using clear, actionable insights to avoid being overwhelmed and to harness AI's full potential.
Walking the Talk
Over the past decade, we have developed a systematic approach to investment portfolio construction, utilizing statistical and quantitative analysis combined with machine learning.
In recent years, we have enhanced our algorithms with AI, enabling us to expand our mission to exponentially expand human wealth using AI to decode the Market Cycle.
After 11 years, we are now guiding over 1,800 investors in 55 countries. I am excited to share the blueprint of our analysis with our clients in a case study format. Here are our top findings in the market today.
DECODING THE S&P 500: Case Study 07/15/2024
Step 1: Initial Portfolio Analysis
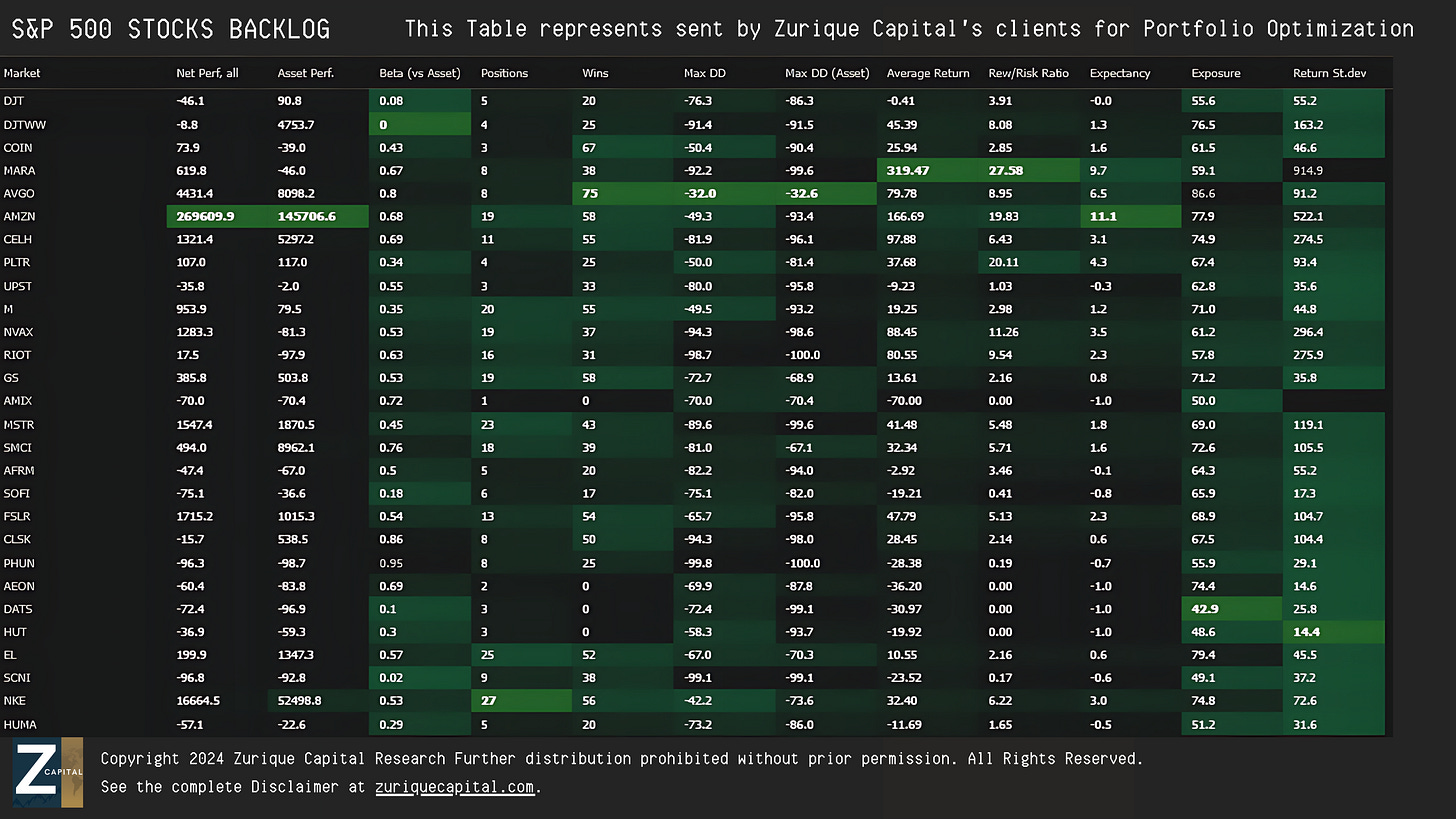
Investors send us the stocks from their portfolios. I have selected the most requested assets today
DJT 0.00%↑ DJTWW 0.00%↑ COIN 0.00%↑ MARA 0.00%↑ #BTCUSD AVGO 0.00%↑ AMZN 0.00%↑ CELH 0.00%↑ PLTR 0.00%↑ UPST 0.00%↑ M 0.00%↑ NVAX 0.00%↑ RIOT 0.00%↑ GS 0.00%↑ AMIX 0.00%↑ MSTR 0.00%↑ SMCI 0.00%↑ AFRM 0.00%↑ SOFI 0.00%↑ FSLR 0.00%↑ CLSK 0.00%↑ PHUN 0.00%↑ AEON 0.00%↑ DATS 0.00%↑ HUT 0.00%↑ EL 0.00%↑ #STLC.TO SCNI 0.00%↑ NKE 0.00%↑ HUMA 0.00%↑
Step 2: Quantitative Treatment
This step employs an advanced algorithm that considers three primary factors:
Alpha 1 - Market Cycle Phase: We begin by analyzing the current market cycle phase of each asset. It is essential to identify the position of each asset within its performance cycle. Assets in a negative cycle are excluded, ensuring that only those with a positive trajectory remain.
Alpha 2 - Probability of Long-Term Uptrend: Next, we examine the historical performance of these assets. The focus here is on identifying those with a strong probability of long-term uptrends. This step ensures that the selected assets have demonstrated consistent positive performance, qualifying them for further analysis.
Alpha 3 - Gain Expectancy: Finally, we project future performance using rigorous quantified analysis to determine each asset's gain expectancy. This approach is grounded in empirical data rather than speculation.
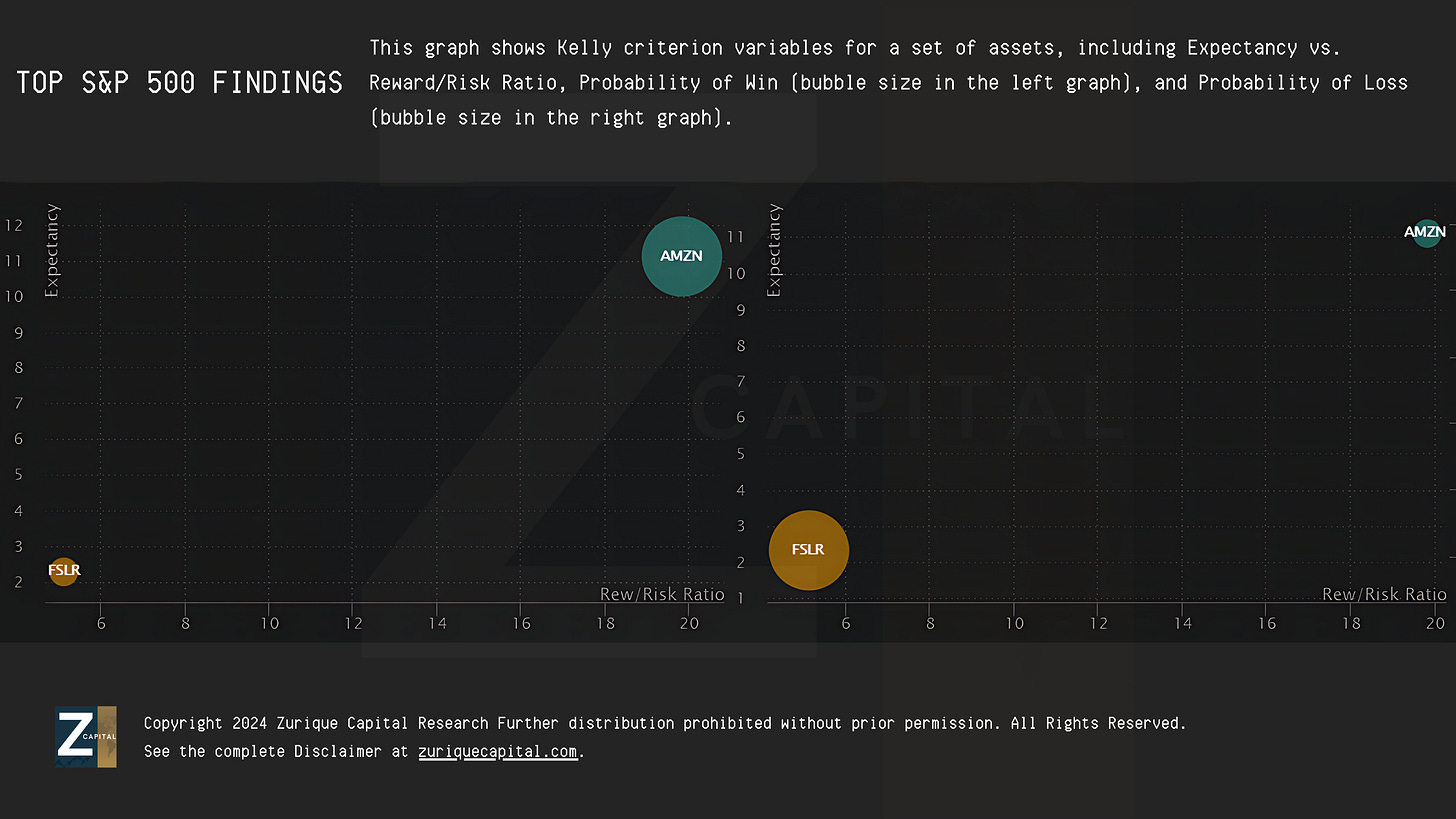
The Top S&P 500 Stocks: AMZN 0.00%↑ FSLR 0.00%↑
Alpha 1 - Market Cycle Phase: Both assets are in a "Positive Cycle" (phases 4 and 3 respectively) indicating they are currently positioned within an upward performance phase.
Alpha 2 - Probability of Long-Term Uptrend: FSLR 0.00%↑ shows a probability of 54%, and AMZN 0.00%↑ shows 58%. This metric evaluates the historical performance of the assets, focusing on their likelihood of sustaining long-term uptrends.
Alpha 3 - Gain Expectancy: FSLR 0.00%↑ has a gain expectancy of 2.30, while AMZN 0.00%↑ has 11.10, indicating the projected future performance of these assets based on empirical data.
Step 3: Wealth Exponential Expansion
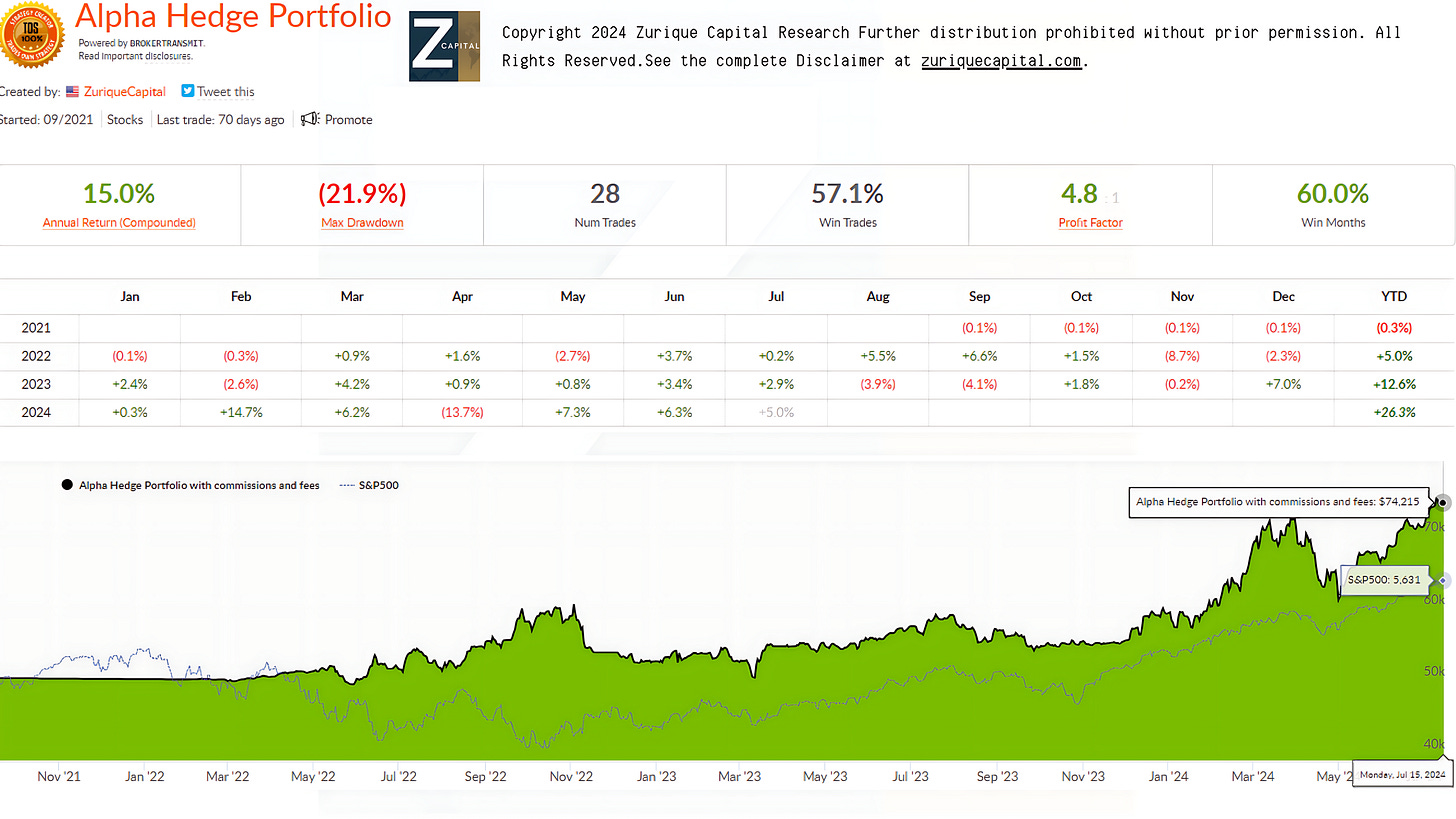
Optimization extends beyond selection to include protection and enhancement. We incorporate the Alpha Hedge Portfolio, constructed based on machine learning, quantitative analysis, and artificial intelligence, designed to amplify returns during bull markets and safeguard investors' capital during bear markets.
This last step of the optimization involves applying the Kelly Criterion calculation to identify the maximum position size of each asset in the portfolio. This provides an additional boost when market conditions are favorable, ensuring your portfolio capitalizes on every opportunity while remaining secure even in adverse market conditions.
ALPHA HEDGE PORTFOLIO REVIEW - 07/15/2024 UPDATE
The Alpha Hedge Portfolio reported a monthly performance of +5.0%, bringing the year-to-date performance to +26.3%. Over the past 34 months, the portfolio has achieved a cumulative performance of +48.8%, outperforming the S&P 500 index, which recorded a +26.3% gain over the same period.


